As a Mixed Martial Arts fan, I thought it would be interesting to analyze fight data to see what insights could be drawn and inferences made as to the in-fight factors affecting the outcome.
photo credit: MAZA FIGHT JAPAN 8Y9A1699-109 via photopin (license)
I found a dataset on Kaggle containing data on nearly 3000 fights that took place between 2013-17 in the Ultimate Fighting Championship (UFC), a US-based MMA promotion. After removing rows with mostly missing data, the dataset was reduced to 1791 rows. I then decided to remove fights that ended in draws and no-contests, which further reduced the size of the final dataset to 1762.
The dataset consisted of some 453 features representing characteristics both of the fight and of one of the fighters. These ranged from variables such as fighter age, current winning streak, and fighter height and weight, to factors like ground control time in each round, submission attempts, and significant strikes attempted and landed to various parts of the body. The goal of the study was to find out whether, given these relevant data from one side of the fight, a model could be trained to determine whether that fighter won or lost.
Since the majority of the available variables concerned events and statistics that became known during the fight (as opposed to before it), this project was intended to be a backward-looking, inferential analysis designed to weigh the most important factors determining victory in an MMA fight.
photo credit: MAZA FIGHT JAPAN 8Y9A4291-114 via photopin (license)
Looking closely at the data, I noted an imbalance between fight winners from the blue and red corners (707 and 1055 respectively). As far as I was aware, the corner colors were assigned at random, in which case one would expect to observe a roughly equal number of winners coming from each class. I decided to test whether the observed imbalance was likely, if the corner assignments are in fact random. The method used was the Chi-square test, a statistical hypothesis test pioneered in 1900 by Karl Pearson. The equation for the Chi-square test incorporates terms for the expected and observed number of results in each possible class:

The minuscule size of the calculated p-value (1.12E-16) demonstrates that the division between red and blue corner winners is not random. Either the assignation of a corner color has an effect on a fighter's performance (almost like home advantage in other sports), or, more likely, the corners are assigned according to some criterion that correlates with a fighter's ultimate likelihood of winning.
I searched extensively on the internet for any discussion on any logic behind the assignments of fighters to corners. Although I could not find any definitive answers, a number of forum posts did indicate that the favorite (in practice either the champion or the higher-ranked fighter) is usually given the red corner. If true, this would at least partly explain the clear imbalance of victories in favor of the red corner.
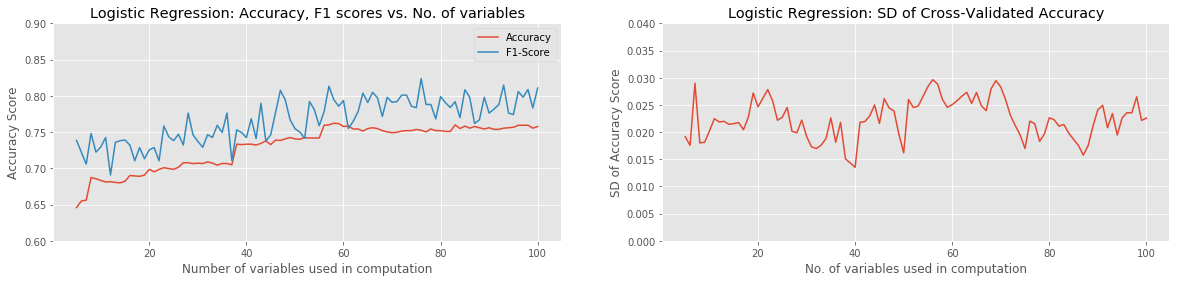
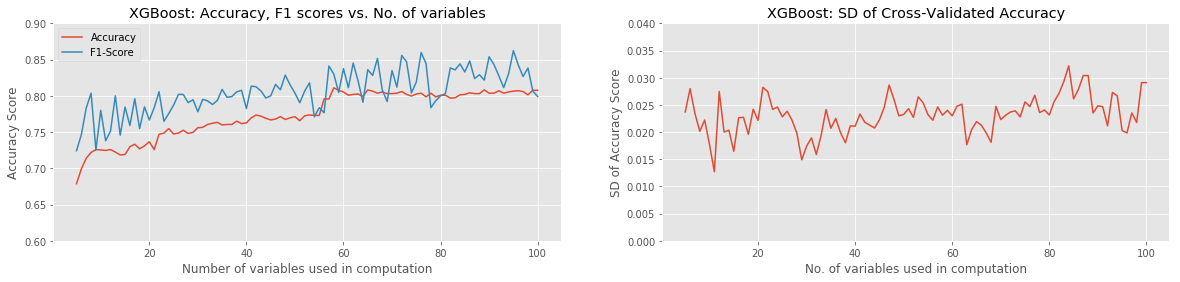
Having cleaned the data, I was ready to choose predictive models and define functions to classify the data and create plots. I chose 6 of the most popular Supervised Learning algorithms: Logistic Regression (no regularization), Random Forest, Gradient Boosting, K-Nearest Neighbors, XGBoost, and Support Vector Classifier. In all cases the models were coded in such a way as to classify on a reduced feature set of varying size, with minimal or no tuning of hyperparameters.
Three different methods were used to select features:
For each method, each Supervised Learning model was run using 8-fold cross-validation to highlight any overfitting. The raw accuracy, F1 score and standard deviation of the accuracy were then plotted against the number of variables used. In this way I was able to compare and evaluate the three feature-selection methods for predictive accuracy, and chart the change in accuracy with this increasing number of variables.

photo credit: MAZA FIGHT JAPAN 8Y9A9111-114 via photopin (license)
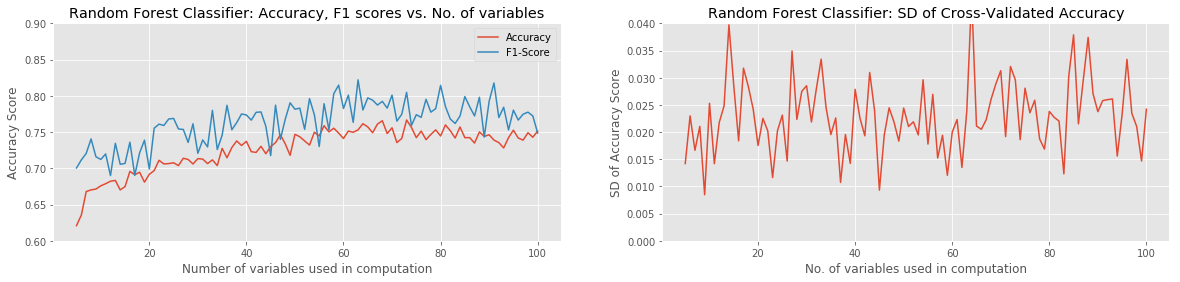
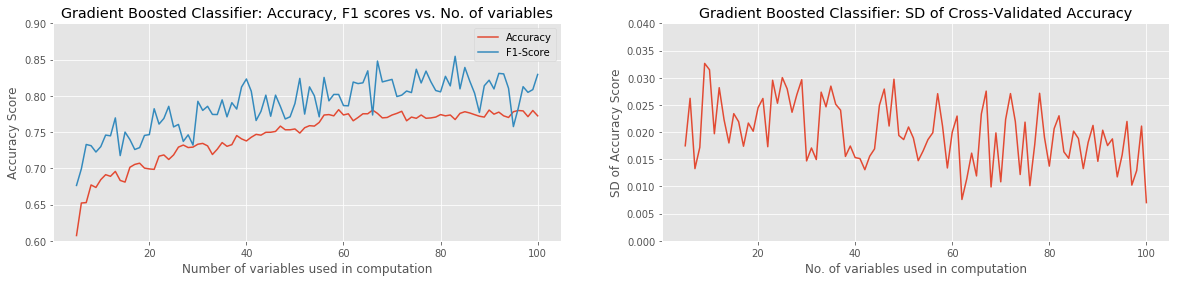
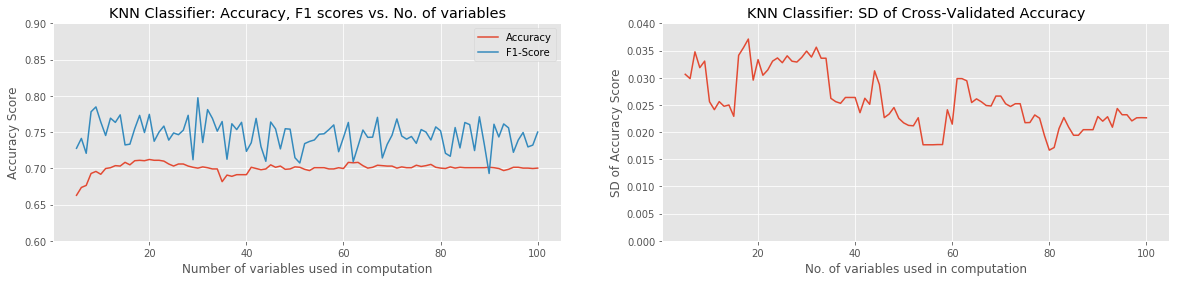
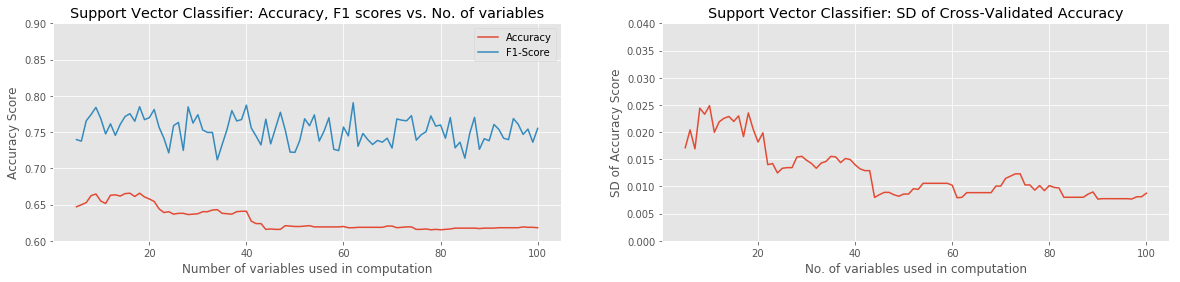
Of the approaches tried, the best combination of ML Model and Feature-Selection method was XGBoost with either Pearson Correlation or ANOVA with SelectKBest. Both combinations were able to reach a raw classification accuracy over 80%, with a peak F1 score of around 85%, using approximately the 60 best variables. Most model combinations were able to achieve around 65% accuracy and 70% F1 score with as few as 5 variables used. Of all models, only the KNN Classifier and Support Vector Classifier failed to gain in accuracy with the addition of more input variables. The SVC actually performed progressively worse as more variables were added. In all cases, χ2 with Select K-Best underperformed the other two Feature-Selection methods.
The standard deviation of the (8-fold) cross-validated accuracy showed the most variation in the case of the Random Forest Classifier. This is an obvious and unsurprising indication that a significant amount of overfitting was occurring at least on some iterations.
A look at the notebook (linked at the bottom of this post) shows that the Pearson Correlation and ANOVA-SelectKBest Feature Selection methods share 97% of their 60 top-ranked variables in common. This ties in with their very similar accuracy and F1 scores. However, the χ2-SelectKBest method only shared 83% of its variables with the Pearson Correlation approach. Looking at the table of variables that were not shared by these two methods, we see the following:
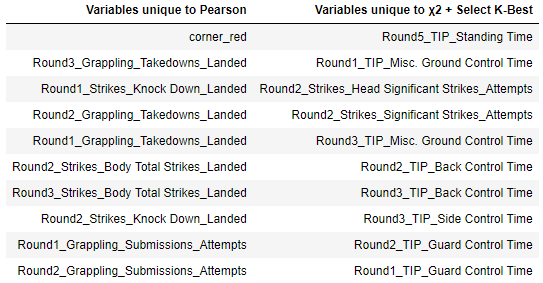
Variables chosen by each Feature Selection method that were not common to the other.
Given that the χ2-SelectKBest analysis was significantly less accurate than the Pearson method, we can infer that the variables identified by that method, that were not shared by the Pearson Correlation variables, were less important in predicting a win for the fighter in question. Of these 10 variables, 7 relate to grappling 'Time in Play', whether through back control, side control, or guard control. This makes sense when one considers that the time spent controlling one's opponent is not necessarily decisive in a fight; rather, the determining factor in the outcome is what the fighter actually does with that time.
photo credit: MAZA FIGHT JAPAN 8Y9A9326-198 via photopin (license)
Looking at the variables identified by Pearson Correlation that were not shared by the χ2-SelectKBest, 7 involve strikes landed, or takedowns achieved; that is to say, they relate to actions successfully completed, rather than time spent. It stands to reason that these variables would have a greater influence in deciding the outcome than simply a length of time spent in control, without necessarily capitalizing on one's position with strikes or a submission attempt.
A more complete version of this analysis, with an appendix and all code used, is available on my Github page.


