Analyzing variations in road safety in the US.

Road safety is something we should all be interested in.
The aim of this project is to analyze variations in road safety in the U.S. This will be done using a dataset containing details of fatal road accidents obtained from the Hightway Traffic Safety Administration
The data examined are from the NHTSA's road fatality database, the Fatality Analysis Reporting System (FARS). This study concentrates on 2016 data, although there were datasets in the FARS repository going back as far as 1975. The repository can be found at ftp://ftp.nhtsa.dot.gov/fars/
Each row in the dataset represents a particular fatal accident. Columns include the state in which the accident occurred, the number and types of vehicles involved, number of pedestrians involved, the time of day, the weather conditions, whether a driver was reported as being drunk at the scene, number of fatalities, and many others. The columns in the dataset are mostly coded; some of the columns' meanings could be deduced intuitively, whereas others had to be looked up. For this, it was necessary to consult the NHTSA's manual, which is located at ftp://ftp.nhtsa.dot.gov/fars/FARS-DOC/Analytical%20User%20Guide/FARS%20Analytical%20Users%20Manual%201975-2016-822447.pdf
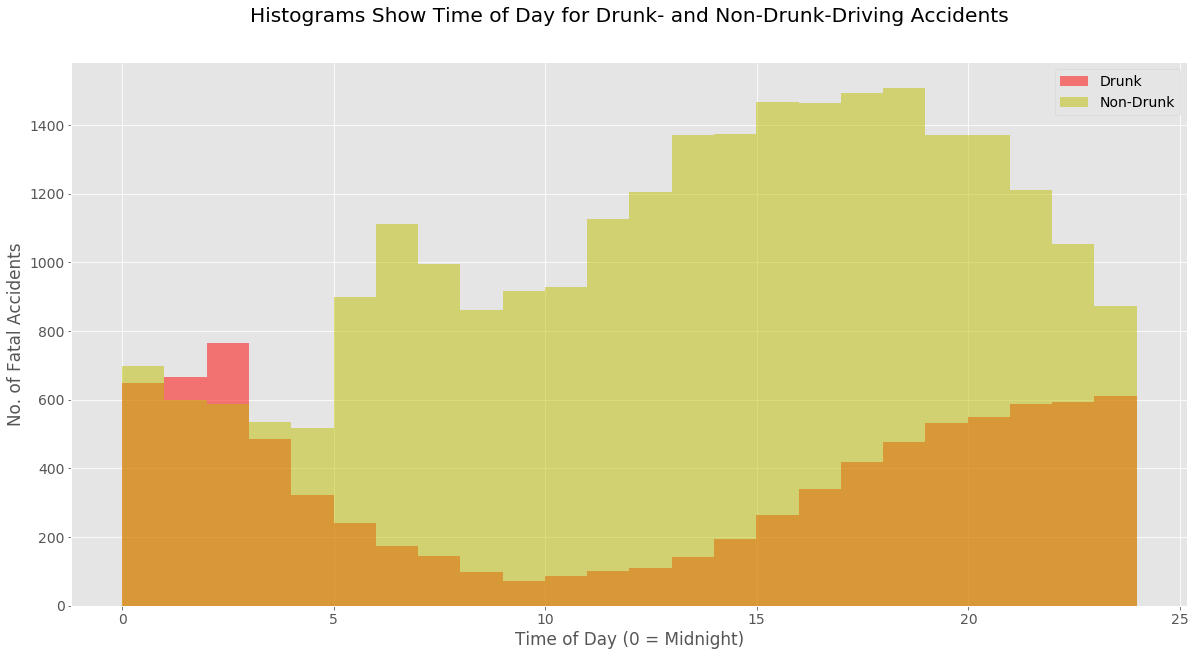
An obvious place to start was the raw numbers of fatal accidents, and to split them between drunk- and non-drunk driving cases:

We are defining an "alcohol-related accident" as one in which one or more drivers were reported as "drunk". Presumably this would be reported as such only if the person's Blood Alcohol Concentration (BAC) exceeded the legal threshold; but it is possible that alcohol may have influenced the outcome of an accident even if the driver was not reported as drunk. The nature of the FARS data gives us no way to quantify this. The timing of the blood alcohol testing is also unknowable; the person's BAC may be below the limit at the time they are tested, even if it was above it when the accident occurred.
The data below give a more meaningful way to compare the data between states. The following chart shows the data adjusted for population and, most important, total miles driven. The plot below shows the number of 2016 fatal accidents (y-axis) vs millions of passenger miles driven (x-axis). The dots are sized according to the populations of the states. These data were obtained from the Insurance Institute for Highway Safety
New York's low number of accidents in relation to its population can be understood in the light of its relatively low number of miles driven, as theorized earlier. In fact, the state even falls some way below the number one would expect if looking at the 'national trend.'California falls far below the national trend, with a much lower number of fatal accidents than its number of passenger miles would suggest.
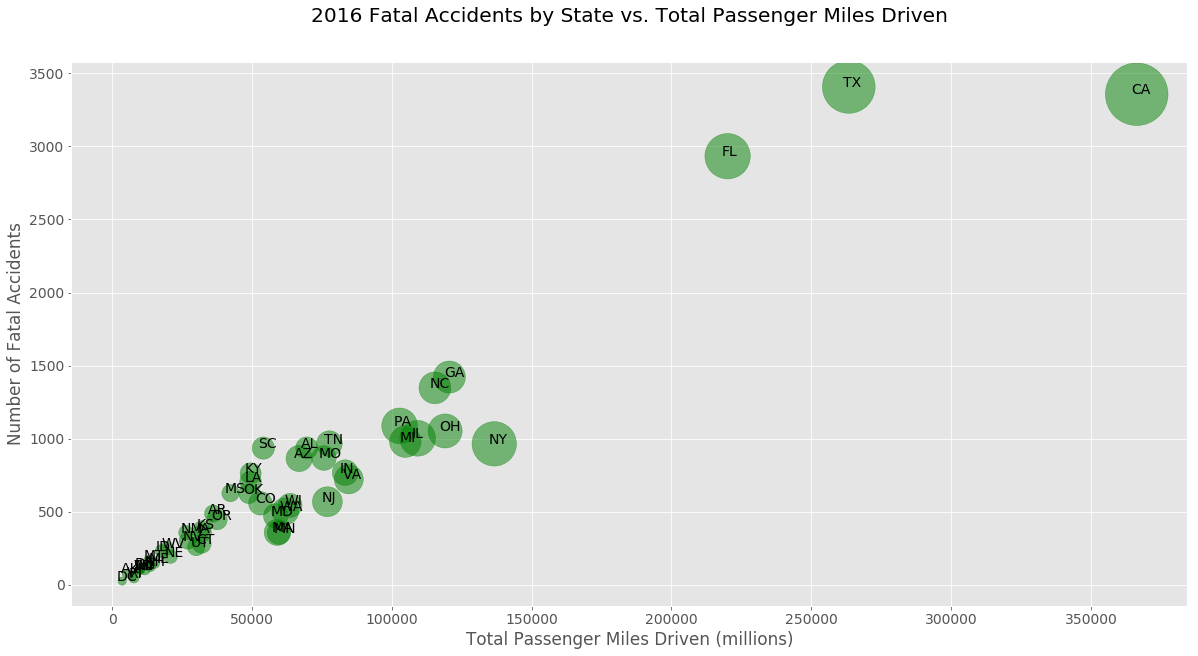
Clearly the California data represent quite a large and significant anomaly from the national trend of fatal accidents vs. total miles driven. The Texas A&M Transportation Institute has highlighted the disparity in recent years between Texas and California Road Fatalities in relation to the states' populations, and has pointed to some possible reasons for it:
http://ftp.dot.state.tx.us/pub/txdot-info/trf/trafficsafety/engineering/comparative-analysis.pdf
This report highlighted the following factors in explaining this disparity: A strong Motorcycle Safety campaign in California over the last decade, plus a strict helmet law. According to the Institute, motorcyclists are 26 times more likely than passenger car occupants to die in motor vehicle crashes. California's stricter stance on cell phone use while driving, with a ban introduced in 2008. Texas, by contrast, did not ban phone use while driving until 2017, as reported by the Fort Worth Star-Telegram:
http://www.star-telegram.com/news/politics-government/state-politics/article170457212.html
The FARS data do not show how many accidents could be considered to have involved a distracted driver. Clearly there are any number of factors that may also be contributing to the disparity between these states. The design and layout of the roads, traffic density, driving speed, driving education, and quality of medical care are just a few of the many factors that the report does not consider.
Sub-tables were created that isolates the accidents in which one or more drunk drivers were reported to have been involved, in order to see any differences between the two datasets. Note that for this analysis and for the plots that follow, the 'day' was defined as being from 0:00 to 23:59 as per the standard 24-hour clock. However, the t-test will define the day as 06:00 to 17:59 since that is the more conventional way in which the daytime is considered.
The conclusions arising from this analysis are as follows:
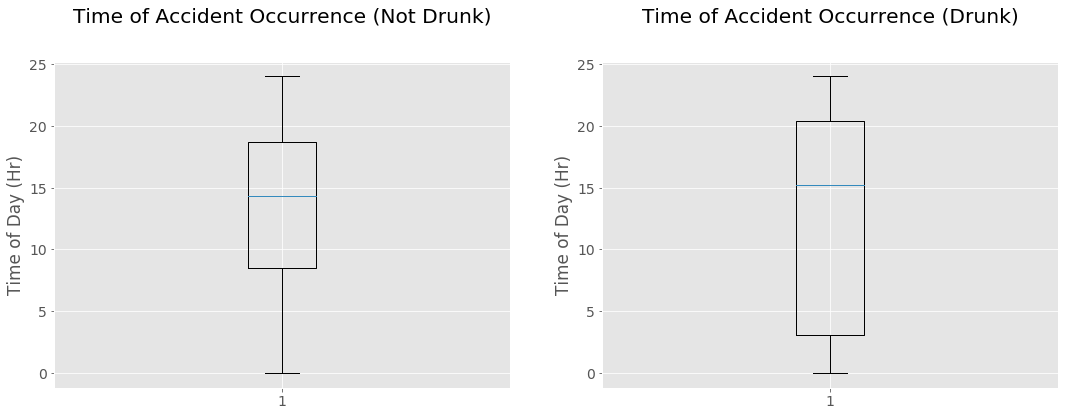
As shown by the code and tables, a t-test on the samples from the drunk and non-drunk data yields a p-value of 0.51. The upper limit for statistical significance for a p-value is 0.05. Thus the difference in sample means is most likely due to sample noise, rather than to any statistically significant difference between the population means.
A study of this nature tends to raise as many questions as it answers. A number of questions arose during project that would be an interesting focus for further investigation. These include, but are not limited to:
A fuller version of this study and the accompanying code can be found here.


