How to group a disparate collection of short texts using unsupervised learning techniques.

Word Representation - the goal of NLP
The corpus to be studied consists of 105 short stories downloaded from various sources on the internet. Sources include the Gutenberg Project and textfiles.com. Authors range from Jack London to Emile Zola, to Fyodor Dostoevsky, to a number of lesser-known authors. The texts are drawn from the romance, science fiction, detective and occult genres. Texts that cannot be easily identified as being from any of those genres are classified as 'miscellaneous'.
In the analysis, each text will be identified by its author and title, and categorized according to its genre and the collection, if applicable, from which it was taken. Publication dates span the period from 1880 to 1992. The full listing of text titles is shown below. Note that only the first 6000 characters of each text were used, due to the limited available processor power.
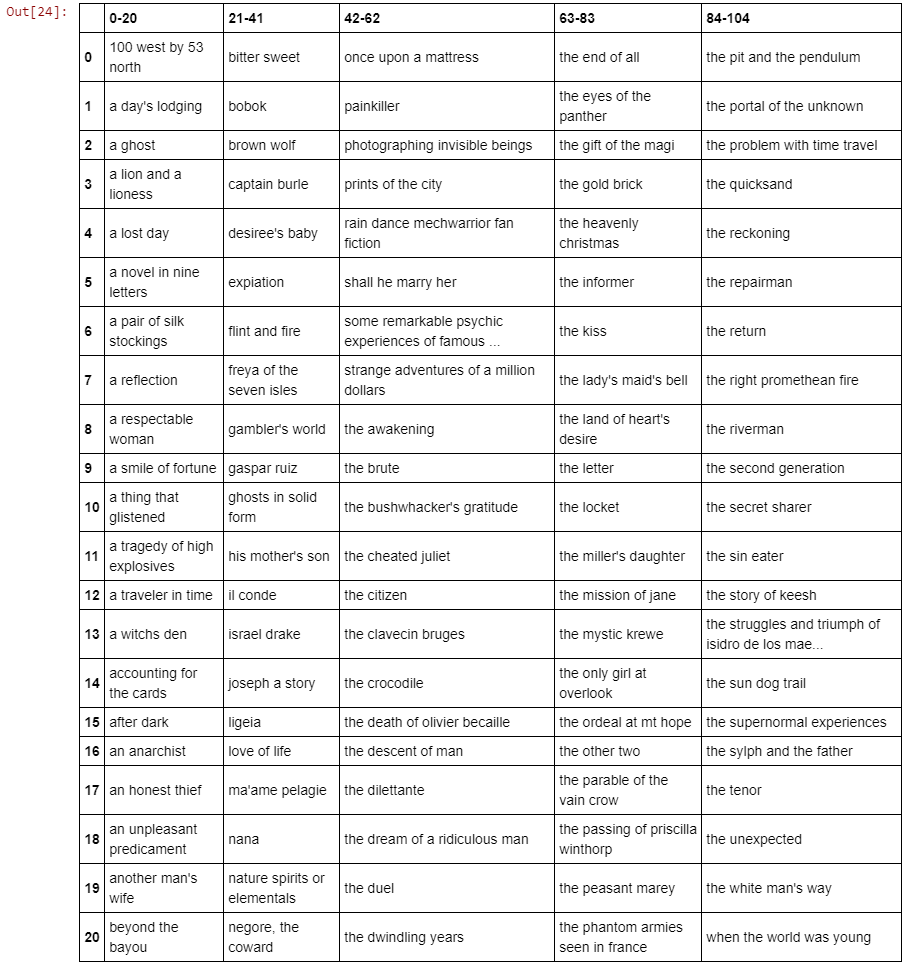
The full corpus of 105 texts.
In order to analyze and compare the texts, they first have to be vectorized. This entails the creation, for each text, of an n x 1 matrix, where n is the number of words within that text (vectorization can also be done sentence-by-sentence but we will do it in such a way that each full text is represented by a single matrix). Each word in the text is then given a coefficient that will be its representative value in the matrix or vector. How this coefficient is calculated is what distinguishes one vectorization model from another.
The Bag-of-Words model, for example, is a simple model that increments the coefficient by one for every time it appears. The TF-IDF (Term Frequency-Inverse Document Frequency) model is more nuanced; it approaches this by assigning a word a higher weighting if it appears several times within a specific text (i.e. it has a high term frequency). On the other hand, that word is penalized, meaning it weighting is reduced, if it also appears frequently in other members of the corpus (hence the inverse document frequency). In calling the TF-IDF vectorizer, a number of parameters are passed.
Create a cosine-similarity table to be used later in validating the clustering solution.
Next, I created a similarity table, consisting of cosine similarity coefficients between all of the possible text pairs contained in the corpus. I next looked at the text pairs that showed the highest and lowest similarity according to their cosine similarity. To do this, define a threshold value above and below the mean, which serves as the cut-off point for these highest and lowest similarities. The number that gives a reasonable number of values in both cases is 1.5 standard deviations. This leads to 163 highest-similarity pairs (2.3% of approx. 6972 possible text-text pairings) and 79 lowest-similarity pairs (1.1% of all possible text-text pairings).
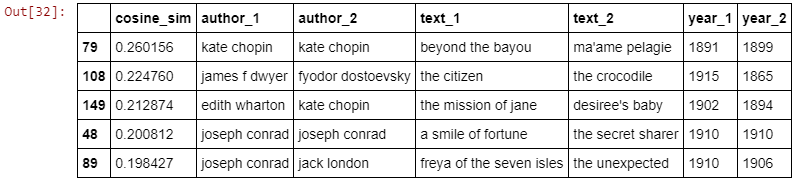
(Some of) The high-similarity pairs.
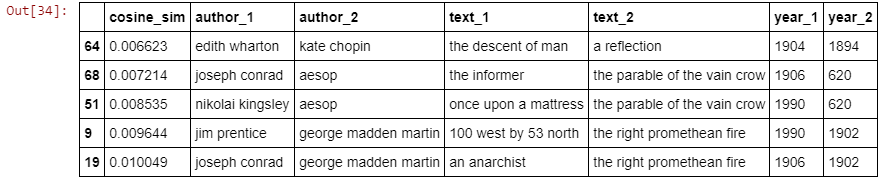
(Some of) The low-similarity pairs.
Having tried a number of clustering techniques with limited success, Affinity Propagation was found to be the best solution. Using this model, the estimated number of clusters is 14. In this part of the analysis, we have no ground truth, so we allow the model to return the number of clusters it sees. The Affinity Propagation model is commonly known to perceive a larger number of clusters than most others.
The solution thus obtained was evaluated using the silhouette score, a measure of clustering model accuracy. For a given datapoint, the silhouette coefficient denotes the strength of the 'connection' between that datapoint and other datapoints in its cluster, as compared to the strength of its connection to datapoints in other clusters. The mean silhouette coefficient among all points in a dataset (or in a cluster) is its silhouette score. Values range from -1 to +1; a score of +1 would indicate perfectly strong, tightly clustered data, whereas -1 would denote virtually no clustering. Thus the 0.007 value obtained suggests moderately cluster quality, with some degree of overlap between clusters.
It was found that some 26% of the pairs in the High Similarity table (i.e. the table of pairs whose cosine similarity is more than 1 standard deviation above the mean) occur in the same cluster. On the other hand, only 2 % of the pairs (i.e. two pairs: The Parable of the Vain Crow, from 620 AD, paired with Gambler's World, a sci-fi story from 1969, and also with The Kiss, an 1894 romance) in the Low Similarity table occur in the same cluster. This provides a satisfying validation of the clustering arrangement computed by the Affinity Propagation model.
The full notebook for this project can be found here.


