With the increasing awareness of difficult encounters between law enforcement and members of minority communities, many have called for changes in the way police officers are trained and monitored in their dealings with the public. In any area of human interaction, one of the most difficult problems to detect is implicit bias.
Many have wondered about implicit bias in the way the police carry out their duties.
This study was conducted using police traffic stop data collected between October 2013 and September 2015 and posted online by the Connecticut Racial Profiling Prohibition Project. The aim of the project is to monitor and combat racial profiling in interactions between the police and road users.
The dataset consisted of 857,895 observations recorded from CT police interactions from 2013-15.
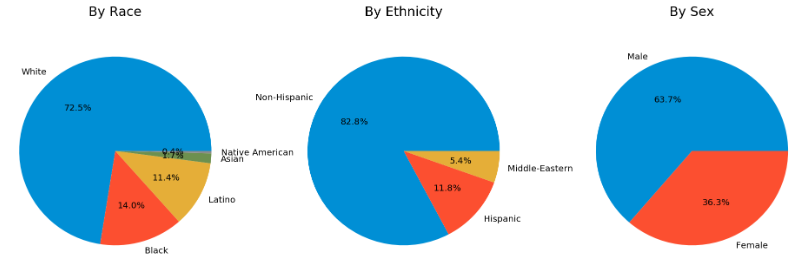
Basic demographics of the dataset.
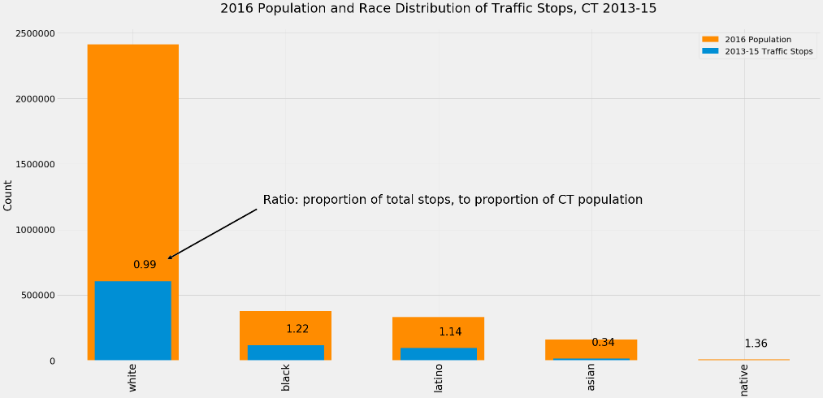
In the plot below, we compare the numbers of stops, broken down by race, with 2016 census population totals for each racial group. Shown above each blue bar, a ratio is shown. This ratio represents that racial group's proportion of total traffic stops, divided by that racial group's proportion of the overall population. A number of 1.0 indicates that members of a given racial group are being stopped at levels in proportion to their percentage of the overall CT population. This assume that the total miles driven for each racial group are commensurate with that group's proportion of the overall population. We further assume that no major demographic changes occurred between 2013 and 2016.
Supposing that a stop occurred due to the motorist's erratic driving, or due to a broken tail light. In theory, one might expect that such a stop would not normally result in a search of the vehicle. We look at the incidence of stops leading to searches, and determine whether the likelihood of this happening is higher for certain groups than for others.
We find, using t-tests, the following:
Black males and Latino males are more likely than average, to a statistically significant degree, to have their car searched during a traffic stop whose original purpose was non-investigative.
Given that a search has taken place, we next look at the frequency with which contraband is found.
Here we find:
Black males are less likely than average to be found to be in possession of contraband. White males are more likely than average to be found to be in possession of contraband, as a result of these non-investigative searches.
Thus the higher likelihood of a search among black and latino motorists is accompanied by a lower than average 'success rate' when it comes to actually finding contraband.
A number of supervised learning runs were done using various models. In this analysis the target variable was the the outcome of the traffic stop, whether punitive (arrest, summons, ticket) or non-punitive (verbal or written warning, or no warning). Each of these models was run using various combinations of input variables, and on varying samples of the dataset, from 1% of the data to 100%. Also, the input feature set was varied to see how that would affect the results. All runs were carried out using 10-fold cross-validation to identify any overfitting. The SD shown is the standard deviation of the fold accuracy.
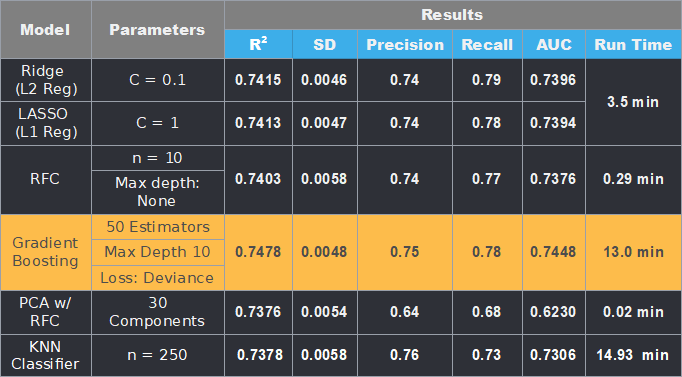
What you see below is a summary of the best of these results for each model type, for a 10% sample of the dataset (approx. 85,000 records). For reasons of brevity, all model/parameter combinations cannot be shown, but the findings can be investigated by changing the sample and model parameters earlier in this notebook. The only model for which no results are shown is the Support Vector Classifier, which was abandoned as it was found to be impractically slow.
The preferred model, and the winner in this analysis, is Gradient Boosting, which gave the best combination of precision, recall, consistency and AUC.
The full notebook for this project can be found here.


